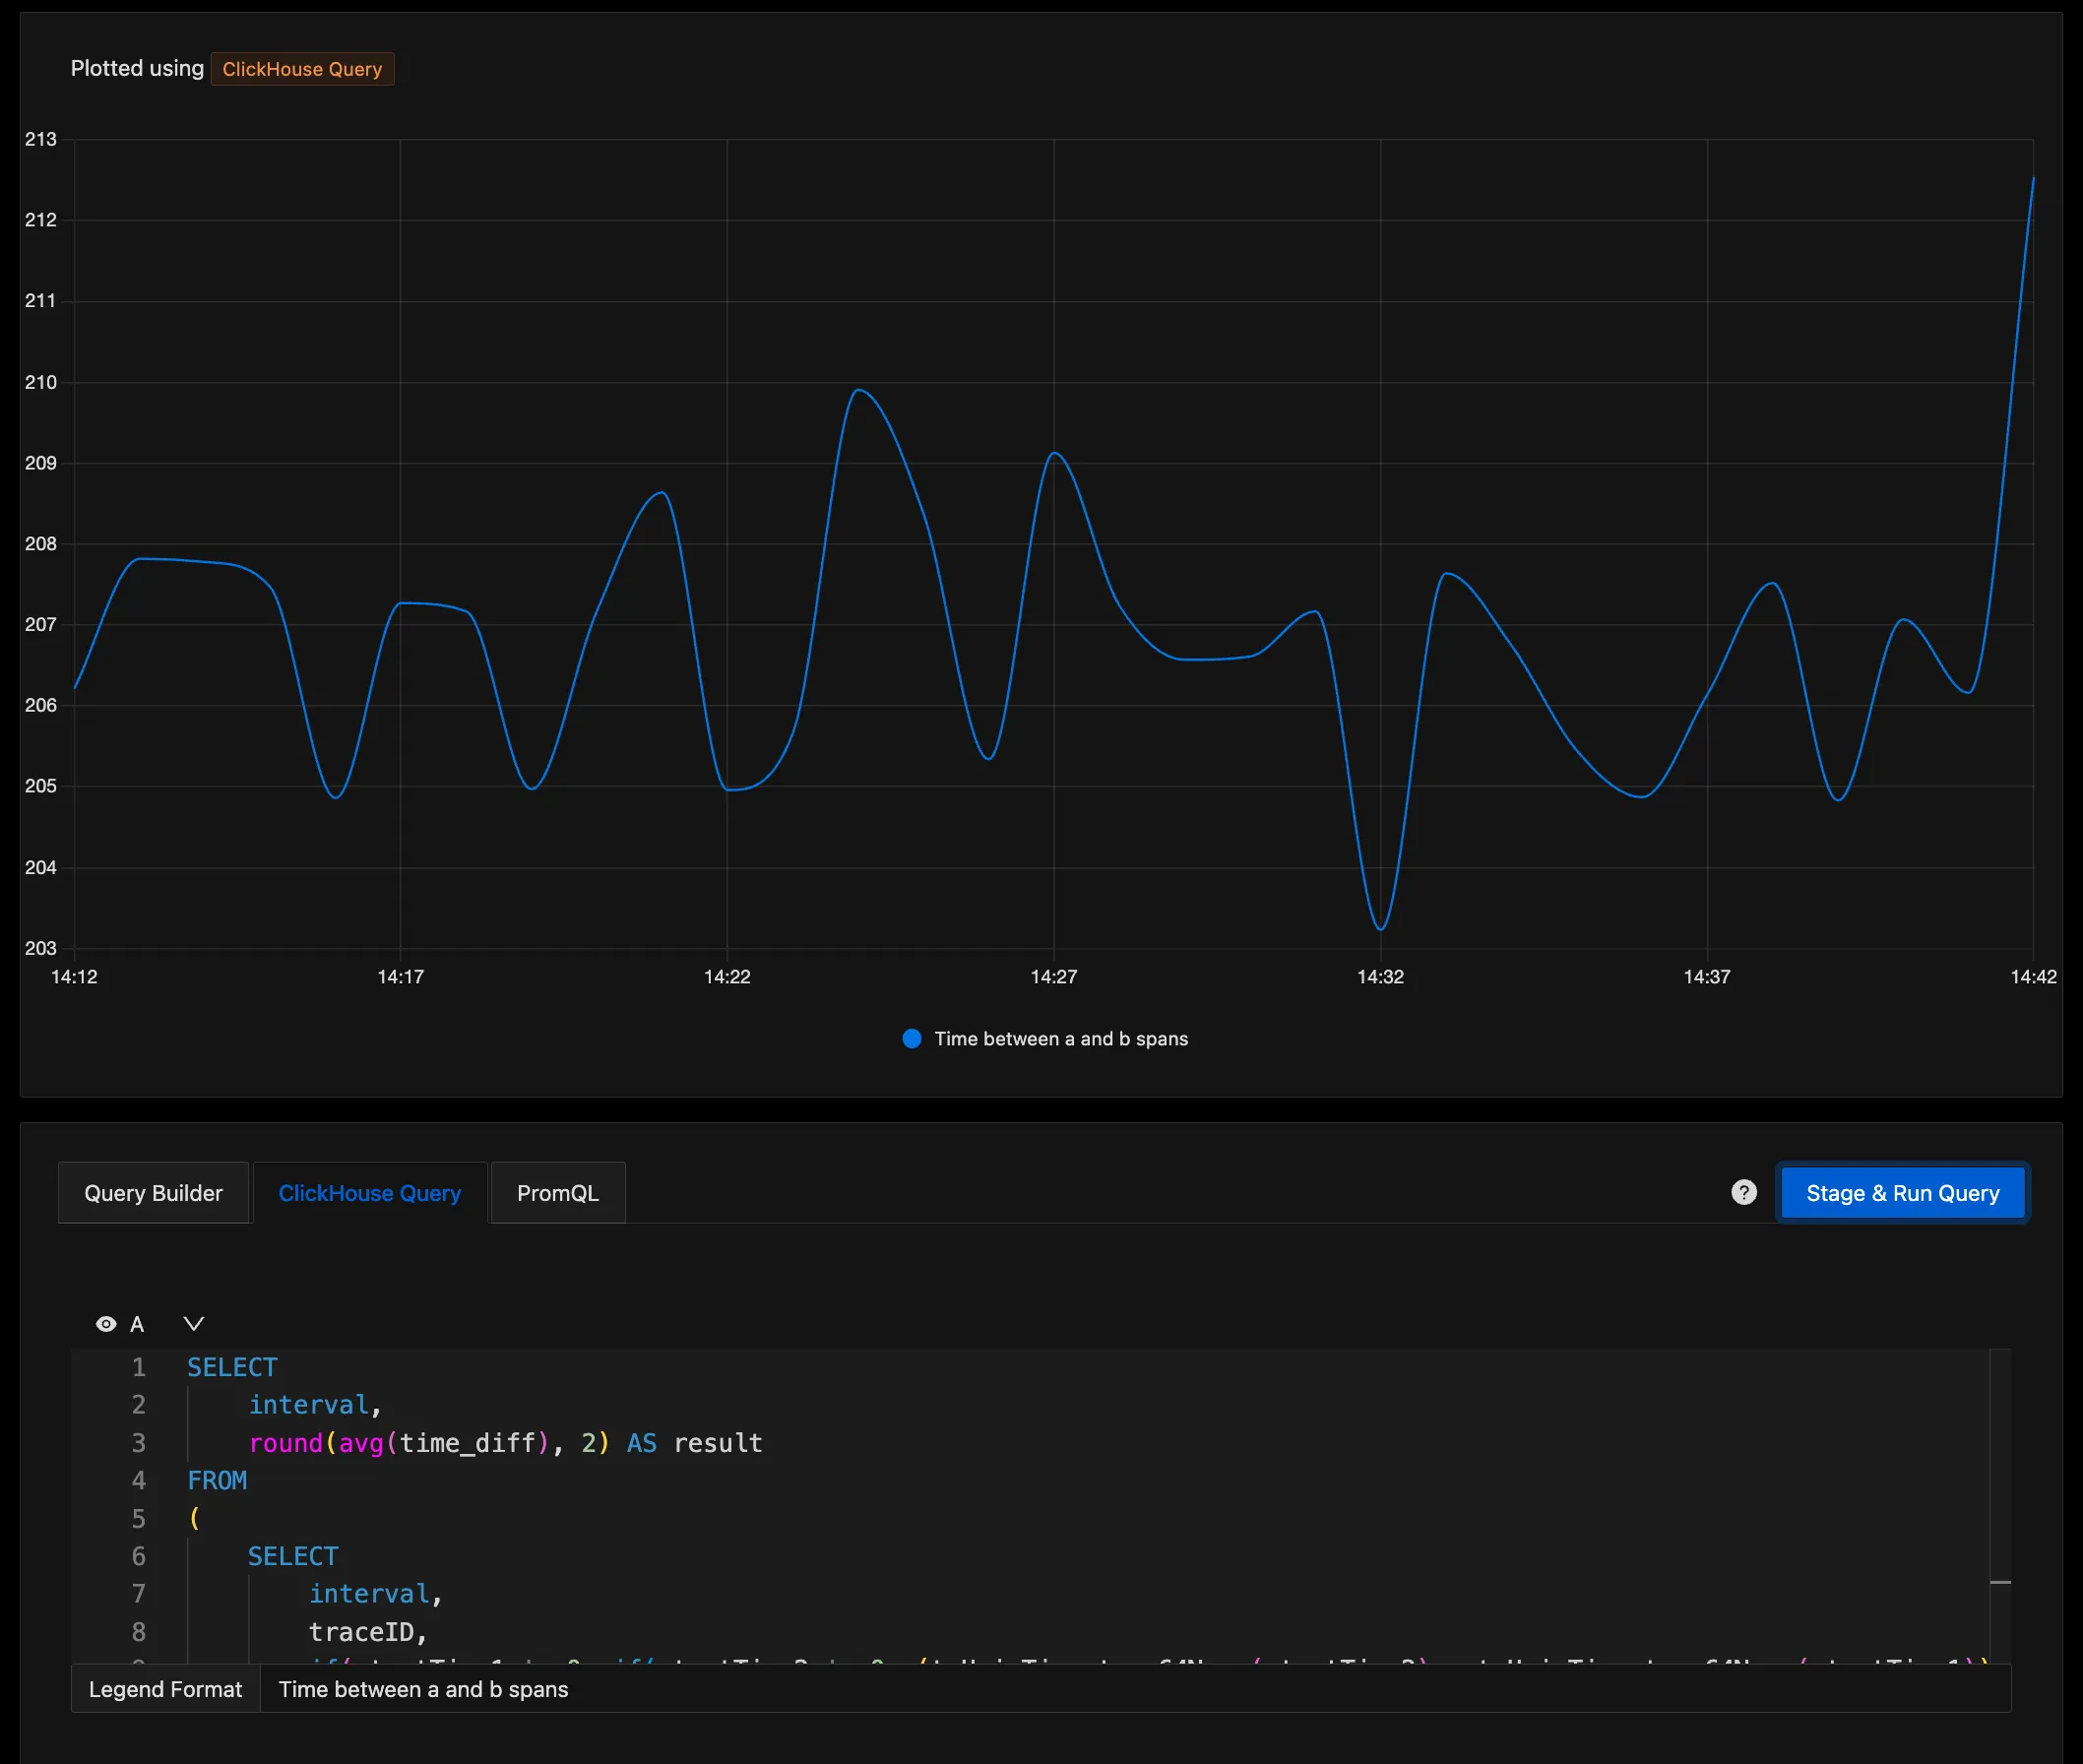
In a recent conversation on our SigNoz community Slack, a user shared their query that asks a deceptively simple question: what is the average time between two spans in a trace?
The usefulness of this answer is evident if you think about how often the total trace time does not highlight the time you care about most. This could mean any number of things: that the total trace time of handling a web request might include lots of spans after a satisfying response was sent to the user. Or the time to handle a critical transaction might happen inside a larger trace.

While it would be great to report a span with this critical section of time, that’s not always feasible. We don’t all control our codebase to the degree we can add custom markers to our tracer, and it’s possible the two spans in question are on very different services, requiring a ton work to tie them together at execution time.
The Power of ClickHouse Queries
Let’s talk about how great Clickhouse has been for SigNoz. Adopted just over two years ago, Clickhouse has enabled blazing speed and simple setup for SigNoz users. Clickhouse also enables queries like this, that aren’t possible in other monitoring tools.
This query plots the average time between 2 spans in a trace which satisfy
- span of service
driverwith name/driver.DriverService/FindNearestand a component name ofgRPC - span of service
routewith nameHTTP GET /route
SELECT
    interval,
    round(avg(time_diff), 2) AS result
FROM
(
    SELECT
        interval,
        traceID,
        if(startTime1 != 0, if(startTime2 != 0, (toUnixTimestamp64Nano(startTime2) - toUnixTimestamp64Nano(startTime1)) / 1000000, nan), nan) AS time_diff
    FROM
    (
        SELECT
            toStartOfInterval(timestamp, toIntervalMinute(1)) AS interval,
            traceID,
            minIf(timestamp, if(resource_string_service$$name='driver', if(name = '/driver.DriverService/FindNearest', if((resources_string['component']) = 'gRPC', true, false), false), false)) AS startTime1,
            minIf(timestamp, if(resource_string_service$$name='route', if(name = 'HTTP GET /route', true, false), false)) AS startTime2
        FROM signoz_traces.distributed_signoz_index_v3
        WHERE (timestamp BETWEEN {{.start_datetime}} AND {{.end_datetime}}) AND (ts_bucket_start BETWEEN {{.start_timestamp}} - 1800 AND {{.end_timestamp}}) AND (resource_string_service$$name IN ('driver', 'route'))
        GROUP BY (interval, traceID)
        ORDER BY (interval, traceID) ASC
    )
)
WHERE isNaN(time_diff) = 0
GROUP BY interval
ORDER BY interval ASC;
The resulting graph gives us a track of the time between these spans, which may be a better indicator of performance than any span created by default.

Charting non-metric data
The power of these queries implies a more general concept: the idea that we can get meaningful time series data from inputs that weren’t explicitly entered as such. In this case it’s not much of a stretch to go from two spans in two different service’s traces to a time series, but this concept can take us further. With our recent release of the logs explorer its becoming easier to calculate a time series based on the frequency of certain parameters within logs, expanding our ability to perform post-hoc analysis on our OpenTelemetry event data.
See more examples of custom queries in the SigNoz query documenation.

